The Java ME SDK 3.0 includes some tools for this. They are not available in the IDE but has to be started from the command line. So you open two command line windows. In the first you start your midlet:
cd C:\Java_ME_platform_SDK_3.0\bin
C:\Java_ME_platform_SDK_3.0\bin>emulator.exe -Xdevice:DefaultCldcPhone1 -Xdebug -Xrunjdwp:transport=dt_socket,suspend=n,server=y,address=51307 -Xdescriptor:[jadfile]
This should start the emulator with your midlet. I choose the DefaultDldcPhone1 which is configured to have 4 MB of heap. You can change that in the device properties if you want to.
In your second command window you start the memory profiler:
cd C:\Java_ME_platform_SDK_3.0\bin
memory-profiler.exe -host 127.0.0.1 -port 51307
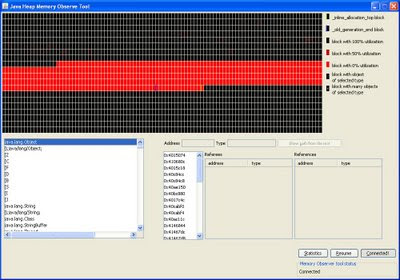
This should open up the memory profiler window. You then press Connect to cennect to your emulator instance.This will take a while but then you get a window something like this:

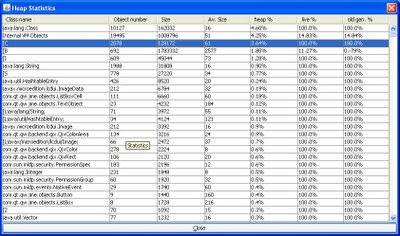
Now you press resume and run your application and try to recreate your memory problems. After that you press Pause in the memory tool. This will cause the tool to get a memory dump from your runing application. You will get a memory map at the top and at the bottom left a list of classes and primitives. You can select a class in the list and see what instances exist. It is however quite difficult to find information this way. Better is to use the statistics button. This will get you a window something like this:

The data is:
- class name or primitive. a [ means 'array of'
- object number (or number of objects rather)
- size
- average size
- % of heap
- live %
- old generation %
6 comments:
Hi Eric,
Tried the same command with emulator.exe on my system.
After giving the command I do netstat -na | find "53107". Does not show anything. Looks like the service is not starting.
Thanks,
Debashis
Hi Eric,
I tried the same command to start the emulator in debug mode on my system.
After running the command I do a netstat -na | find "51307", which doesn't show anything listening to that port.
Any idea what could be wrong?
Thanks,
Debashis
Hi!
When I try this on my system I get the following:
netstat -na| find "51307"
TCP 0.0.0.0:51307 0.0.0.0:0 LISTENING
so it looks like something is wrong. Are you running Windows firewall?
Erik
Thanks Erik
I find this tips is very useful. I use Vista and can follow the steps without problem. Vichet
Hi Erik
I find this tip is very useful.
Thanks,
Vichet
In Eclipse IDE you must find port number at Debug View. There you find ...DefaultCldcPhone1 at locahost 4618.
So in memory profiler uses port 4618. But in my case only one debug session can be connect for VM, so I must close SDK Toolbar and Elicpse debug session.
Post a Comment